Four hundred and one workers
Work, wages, debt, health and social protection among informal workers in Sukhasan and Chitoriya panchayats, Katihar district, Bihar
Contents
Why this survey was done
India counts its informal workers in national surveys that are designed to represent states, not tolas. The Periodic Labour Force Survey gives Bihar a casual wage figure; the National Family Health Survey gives Katihar a sanitation figure; the e-Shram portal gives Bihar a registration count. None of these tells an organisation working in six wards of one panchayat whether the people it works with hold the cards they are entitled to, what they earn when they do get work, how much they owe, and whether they know what the card in the house is for. That is the gap this survey was built to fill.
Act Now India interviewed 401 informal workers in two gram panchayats of Katihar district between 27 May and 20 September 2026. The questionnaire asked 38 questions in Hindi about occupation, days of work, wages, payment practice, household income, debt, food, housing, sanitation, health and health spending, safety at work, knowledge of wage law, receipt of five government schemes, barriers to them, migration, children’s schooling, and what people themselves consider the biggest problem.
This report describes those 401 people. It sets their answers against the Census, the National Family Health Survey, the All India Debt and Investment Survey, the Periodic Labour Force Survey and administrative counts, so that readers can see where this group sits relative to the district and the state. It also tests, with regression, whether the differences between women and men, between castes, and between the two panchayats survive adjustment for the other characteristics. It does not claim to represent Katihar, and the reasons are set out in the methods and limitations sections.
The setting: Katihar, Barari and Mansahi
Katihar lies in Seemanchal, in the north-east corner of Bihar, where the Ganga, the Kosi and the Mahananda meet. The 2011 Census counted 3,071,029 people in the district, 91.1 per cent of them rural, with a literacy rate of 52.2 per cent, well below the state figure. Scheduled Castes were 8.6 per cent of the district population and Scheduled Tribes 5.9 per cent, the tribal share being unusually high for Bihar, where Scheduled Tribes are about 1.3 per cent of the population.
On the national Multidimensional Poverty Index, Katihar’s headcount ratio fell from 62.4 per cent in 2015-16 to 44.2 per cent in 2019-21, a drop of 18.2 percentage points, one of the sharpest in Bihar and still among the highest levels in the country (NITI Aayog 2023). The district’s NFHS-5 figures place it below the Bihar average on most living standards: 44.6 per cent of the population lived in a household using an improved sanitation facility, against 49.4 per cent for Bihar; 16.9 per cent of households used clean cooking fuel, against 37.8 per cent; and 8.4 per cent of households had any member covered by a health insurance or financing scheme, against 14.6 per cent for the state.
Sukhasan is a gram panchayat in Barari block, on the Ganga floodplain; Chitoriya is in Mansahi block. Both lie in a part of Bihar where the annual flood is a fact of the agricultural calendar rather than an exceptional event, and where the farm labour market is sharply seasonal. Act Now India works in six wards of Sukhasan and mainly in wards 3 and 4 of Chitoriya. The survey was carried out in those wards, which is the reason the sample looks different from the district: it contains far more Scheduled Caste and Scheduled Tribe respondents than Katihar as a whole.
What is already known
The National Commission for Enterprises in the Unorganised Sector, reporting in 2007, put the share of Indian workers outside any formal social-security arrangement at roughly nine in ten, and argued that the central problem was not the absence of law but the absence of any mechanism by which law reached workers with no employer of record. Jan Breman’s work on footloose labour in western India, and Barbara Harriss-White’s account of the Indian economy below the level of the registered firm, both describe the same structure from the field: wage relations mediated by contractors, no written record of employment, and a workforce that moves between agriculture, construction and migration within a single year. Survey data since then has repeatedly confirmed the pattern rather than overturned it. In the Periodic Labour Force Survey for 2023-24, 19.8 per cent of workers were casual labourers and 46.1 per cent of all workers were in agriculture.
India sets minimum wages by state and by scheduled employment, which produced well over a thousand separate rates before the Code on Wages, 2019 began to consolidate them. The Economic Survey 2018-19 devoted a chapter to the resulting system and noted that one in three wage workers was not covered by minimum wage law at all, and that non-compliance was concentrated among rural casual workers and women. Research has reached similar conclusions: a 2021 study in World Development, using a new dataset of more than 1,500 Indian minimum wage regimes, found non-compliance higher for casual workers, for women, for unskilled work and in rural areas, and found the shortfall below the minimum to be large where it occurs rather than marginal. Soundararajan (2019), studying construction workers, modelled minimum wages as imperfectly enforced and found effects that depend on the degree of enforcement.
The most recent national estimate comes from SBI Research, which used Periodic Labour Force Survey 2025 data to conclude that about one in four casual workers in India is paid below the applicable statutory minimum, with marked variation between states, and that women make up about 45 per cent of the underpaid though they are about a quarter of the casual workforce. That last figure is the closest national comparator to what this survey finds in Katihar.
India’s approach to informal-sector social protection over the past decade has been to build databases and issue cards: e-Shram for unorganised workers, state welfare boards for construction workers, Ayushman Bharat for hospital care. The administrative counts are large. By August 2026, e-Shram held 31.89 crore registrations nationally, with Bihar second only to Uttar Pradesh at about 3.24 crore. Whether registration converts into benefit is a separate question, and the evidence suggests it often does not. A cross-sectional study in rural Bihar published in Cureus in 2023 found awareness of Ayushman Bharat at 68.6 per cent, card possession at 58 per cent among eligible and aware respondents, and utilisation of the scheme at 1.3 per cent. This report returns to that gap repeatedly, because the survey measured receipt and understanding separately.
Out-migration for work from Bihar is twice the all-India rate on Census 2011 figures, and the dominant destinations are Delhi, the Punjab and Haryana belt, Maharashtra and Gujarat. Village-level work in rural Bihar reported in 2020 found that Punjab, Delhi and Haryana together accounted for about half of all migrant workers from the state, that over eight in ten migrants aged 15 to 64 were workers, and that median earnings at destination were low enough to fall below statutory minimum wages in many destination states. Kerala has become a substantial destination more recently: a study for the Kerala State Planning Board estimated 31.4 lakh migrant workers in the state, about 26 per cent of its workforce, drawn mainly from West Bengal, Assam, Uttar Pradesh, Bihar, Odisha and Jharkhand.
The All India Debt and Investment Survey of 2019 put the incidence of indebtedness in rural India at 35 per cent of households as on 30 June 2018, with 28.2 per cent among non-cultivator households, and the average debt among indebted rural households at Rs 1,70,533. Institutional lenders accounted for about two-thirds of outstanding rural debt. On health, the standard international marker of financial hardship is household health spending at or above 10 per cent of total consumption or income, used as Sustainable Development Goal indicator 3.8.2. The survey reported here allows a conservative version of that calculation, and the result is reported in section 9.
Data and methods
The questionnaire is a revision of an earlier 58-question schedule. It was cut to 38 questions and extended to cover debt, food adequacy, housing, sanitation, health spending, financial stress and safety equipment, which the earlier version did not ask about. Questions were printed in Hindi, administered face to face, recorded on paper, and then entered into a KoboToolbox form carrying Hindi and English labels. Most answers are categorical bands rather than continuous values, which limits precision and is discussed under limitations.
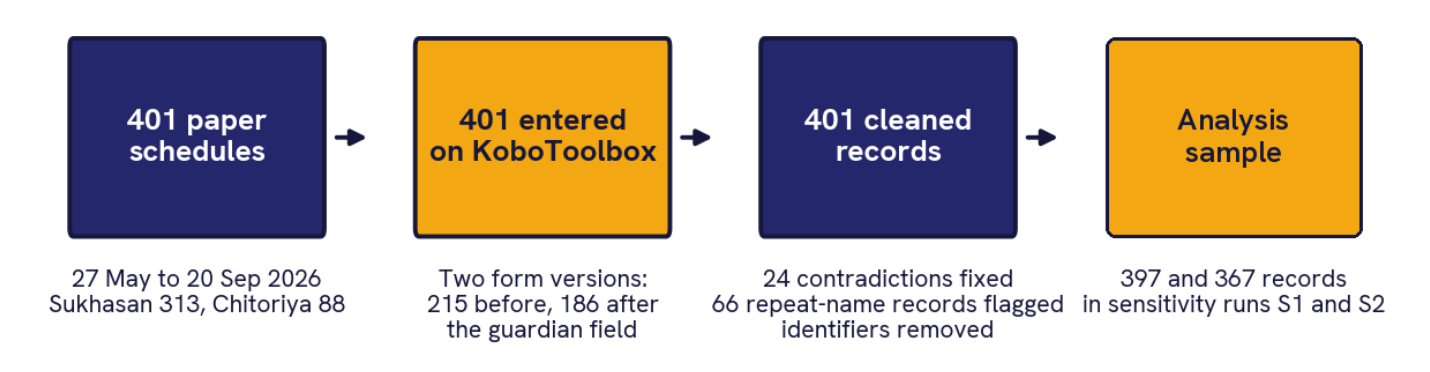
Respondents were selected by the field team from the wards in which Act Now India works. There was no sampling frame, no enumeration of the eligible population and no random selection. The sample is therefore purposive, and every percentage in this report is a statement about the 401 people interviewed. Two features of the ward structure matter for interpretation. First, wards are segregated by community: ward 12 of Sukhasan is almost entirely Muslim, ward 15 is mostly Hindu OBC, wards 17 and 20 contain most of the Scheduled Tribe respondents, and 61 of the 88 Chitoriya respondents are Scheduled Caste. Any comparison between communities is therefore also a comparison between tolas, and the survey cannot separate the two. Second, the sample over-represents Scheduled Caste and Scheduled Tribe households relative to the district, which is a consequence of where the organisation works, not an error.
Every record was checked field by field before analysis and every change written into a log that accompanies the dataset. In 24 records a respondent had ticked “none of these” alongside a specific answer; the specific answer was kept. Enumerator names appeared in nine spellings and were standardized to five people. One paper number was used twice and another is missing from the sequence; both records were kept and flagged. Thirty-two names occur more than once across 66 records, and the treatment of these is set out in section 18 and Annex A2. Respondent names and guardians’ names were removed from every file that accompanies this report.
Three constructed measures carry much of the argument, and each is built to give the smallest defensible number rather than the most striking one.
The earnings ceiling takes the top of a respondent’s reported days-worked band and multiplies it by the top of the reported daily-wage band. If that product falls below Rs 11,336, which is the Bihar unskilled minimum wage of Rs 436 a day for 26 days, the respondent cannot reach a monthly minimum wage even in the most favourable reading of their own answers. Because both bands are read at their upper limit, the measure understates the shortfall.
The health hardship measure divides the lowest value in a respondent’s annual health spending band by the highest value in their monthly household income band multiplied by twelve. A respondent crosses the 10 per cent threshold only if the least unfavourable combination of their two answers still crosses it, so the resulting share is a floor.
The deprivation count adds eight binary indicators drawn from different domains: working 20 days a month or fewer, an earnings ceiling below the monthly minimum wage, wages paid late, household debt, a skipped meal in the past month, a kachcha house, no toilet in use, and no scheme received. It is calculated only for the 348 respondents who answered all eight. It is a descriptive count in the spirit of the Alkire-Foster method used by the national Multidimensional Poverty Index, but it is not that index and the two are not comparable.
Percentages are reported over those who answered the question, and the number answering is given with each figure. Ninety-five per cent Wilson score intervals are reported for the headline indicators in Annex A1. Those intervals assume random sampling, which did not occur here, and should be read as a guide to precision rather than as inference to a population. Group differences are tested with Pearson chi-square tests. Adjusted associations are estimated with logistic regression, reported both as odds ratios and as average marginal effects in percentage points.
Inference needs more care than usual here because respondents are clustered in nine wards and conditions within a tola are correlated. Three things are done about it. Standard errors are clustered on ward in every model. Every claim that this report makes about statistical significance is then re-tested with a wild cluster restricted bootstrap using Rademacher weights and 1,999 replications, applied to the equivalent linear probability model, which is the standard correction when the number of clusters is small (Cameron, Gelbach and Miller 2008). Because that bootstrap is conservative with nine clusters, a finding that survives it is reported as robust and a finding that does not is reported as suggestive, in the text and in Annex A5. Finally, the gender result, which is the largest in the data, is re-estimated with ward fixed effects, so that it rests only on comparisons between women and men living in the same ward. All estimates are cross-sectional associations and none of them identifies a causal effect.
Who was surveyed
| Characteristic | Number | Share of 401 | District or state comparator |
|---|---|---|---|
| Sukhasan GP, Barari block | 313 | 78% | Six wards |
| Chitoriya GP, Mansahi block | 88 | 22% | Mainly wards 3 and 4 |
| Women | 152 | 38% | |
| Men | 249 | 62% | |
| Other Backward Classes | 209 | 52% | |
| Scheduled Caste | 110 | 28% | 8.6% of Katihar (Census 2011) |
| Scheduled Tribe | 76 | 19% | 5.9% of Katihar (Census 2011) |
| General | 5 | 1% | |
| Hindu | 257 | 64% | |
| Muslim | 111 | 28% | |
| Christian | 25 | 6% | 22 of the 25 are Scheduled Tribe |
| Aged 36 to 45 | 141 | 35% | Median band of the sample |
| No schooling | 97 | 24% | Katihar literacy 52.2% (Census 2011) |
| Primary schooling only | 189 | 47% | |
| Farm or construction labourers | 307 | 77% | 19.8% of Indian workers are casual (PLFS 2023-24) |
Table 1. Composition of the sample. One respondent has no social category recorded and two have no education recorded. The comparator column is for orientation; the sample was not drawn to represent the district.
The sample is poorer and more labour-dependent than the district average, and more Dalit and Adivasi. Three quarters recorded their work as farm or construction labour, a further 12 per cent as domestic work, 2 per cent as street vending and 9 per cent as something else, a category that includes a tractor driver, an ASHA worker, bamboo workers, small shopkeepers and four women who recorded themselves as homemakers.
Those categories need a note, because Act Now India uses the term domestic work more broadly than the questionnaire implies. In the organisation’s practice it covers three groups: women working in other people’s homes, women doing part-time work in agriculture, and housewives. Respondents, filling in a form that offered “labour (construction or farm)” as a separate option, generally chose that option for part-time farm work. The 99 women recorded here as labourers are therefore, in the field team’s own classification, mostly part-time agricultural workers rather than construction labour, and the survey’s occupational split should be read as self-description rather than as the organisation’s categories. Where this matters for interpretation, the report says so.
Work, days and wages
The first finding concerns time rather than rate. Eighty-six per cent of respondents get 20 days of work a month or fewer, and 23 per cent get ten days or fewer. Only 13 per cent work 21 days or more. Against this, 66 per cent report a usual daily wage between Rs 401 and Rs 600, which brackets the Bihar statutory minimum of Rs 436 a day for unskilled work, and 31 per cent report Rs 400 or less. That rate was notified by the Labour Resources Department on 24 September 2025 as a basic wage of Rs 428 plus variable dearness allowance of Rs 8, and it applied to all 89 scheduled employments in the state from 1 April to 30 September 2026. The whole fieldwork period, 27 May to 20 September 2026, falls inside that window, so a single legally current rate applies to every interview in this survey. Under the Code on Wages (Bihar) Rules, 2026, notified in July 2026, the allowance is revised each 1 April and 1 October, so the comparison made here is fixed to the law as it stood during fieldwork rather than to any later rate.
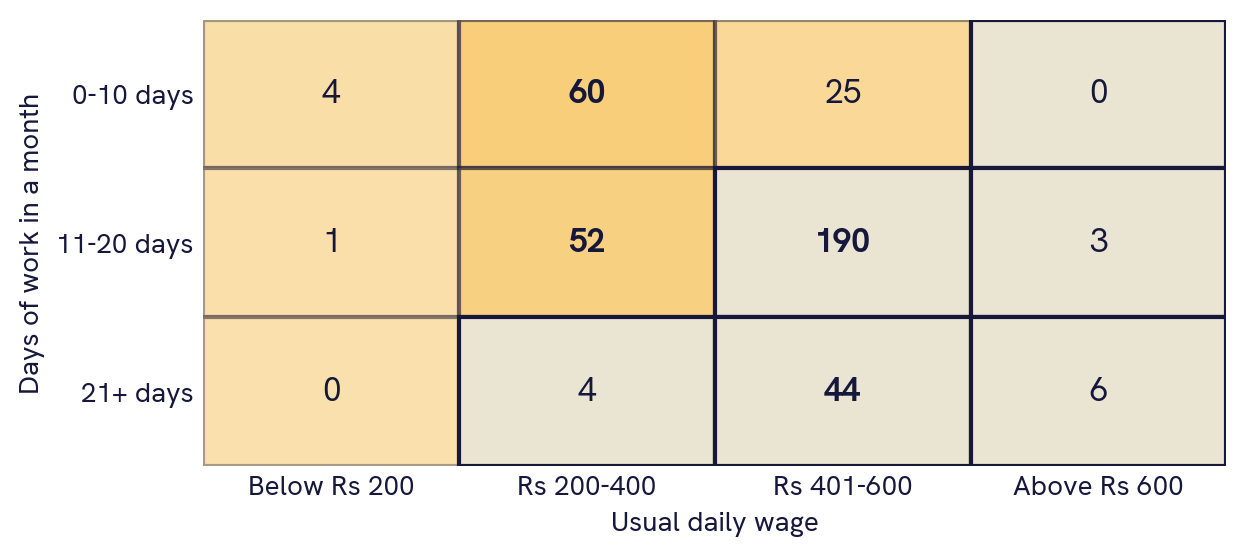
Combining the two answers gives the earnings ceiling described in the methods. One hundred and forty-two respondents, 37 per cent of those who answered both questions, sit in a cell where even the best case falls short of a monthly minimum wage. A second statement can be made without any combination: the 31 per cent who report Rs 400 a day or less are paid below the statutory daily minimum, and so are an unknown part of the Rs 401 to 600 group, namely anyone paid between Rs 401 and Rs 435. Thirty-one per cent is therefore a floor on daily-rate non-compliance in this sample.
These levels are consistent with the state picture and worse than the national one. The Periodic Labour Force Survey recorded average daily earnings of Rs 416 for rural male casual workers in Bihar in the July to September quarter of 2023-24, against Rs 423 for rural males nationally and Rs 289 for rural females. SBI Research, using the 2025 round, estimated that about a quarter of Indian casual workers are paid below the applicable minimum. In this sample the floor is 31 per cent and the ceiling measure puts 37 per cent below a full-time minimum-wage month.
Work is also irregular in a way that the usual categories conceal. Asked about the nature of their work, 47 per cent said regular, 37 per cent casual and 16 per cent seasonal. Yet 80 per cent of those who called their work regular still get 20 days or fewer in a month. Respondents appear to have used “regular” to describe a steady relationship with one contractor or employer rather than steady days, and the next round should separate the two.
Payment practice compounds the problem. Seventy-nine per cent report some delay in wages and 5 per cent say payment is held back for months, leaving 16 per cent paid on time. Only 8 per cent have ever had a written contract and 70 per cent never have. Forty per cent say they know nothing at all about minimum wages or their rights at work, and 5 per cent say they know them well. Fifty-nine per cent are given no safety equipment, and 57 per cent say there is no compensation after an accident at work. Seventy-four per cent report back or joint pain caused by their work.
The gender gap in pay
One hundred and fifty-two women were interviewed. Forty recorded domestic work, 99 recorded labour and 13 something else. The field team’s own description of these women is more precise than the form allows: most are in part-time agricultural work, with far fewer in construction or similar trades. That matters for how the wage figures should be read, and it is taken up below. On every measure of pay women are worse off than the men of the same villages, and the gap is the largest single difference in the dataset.
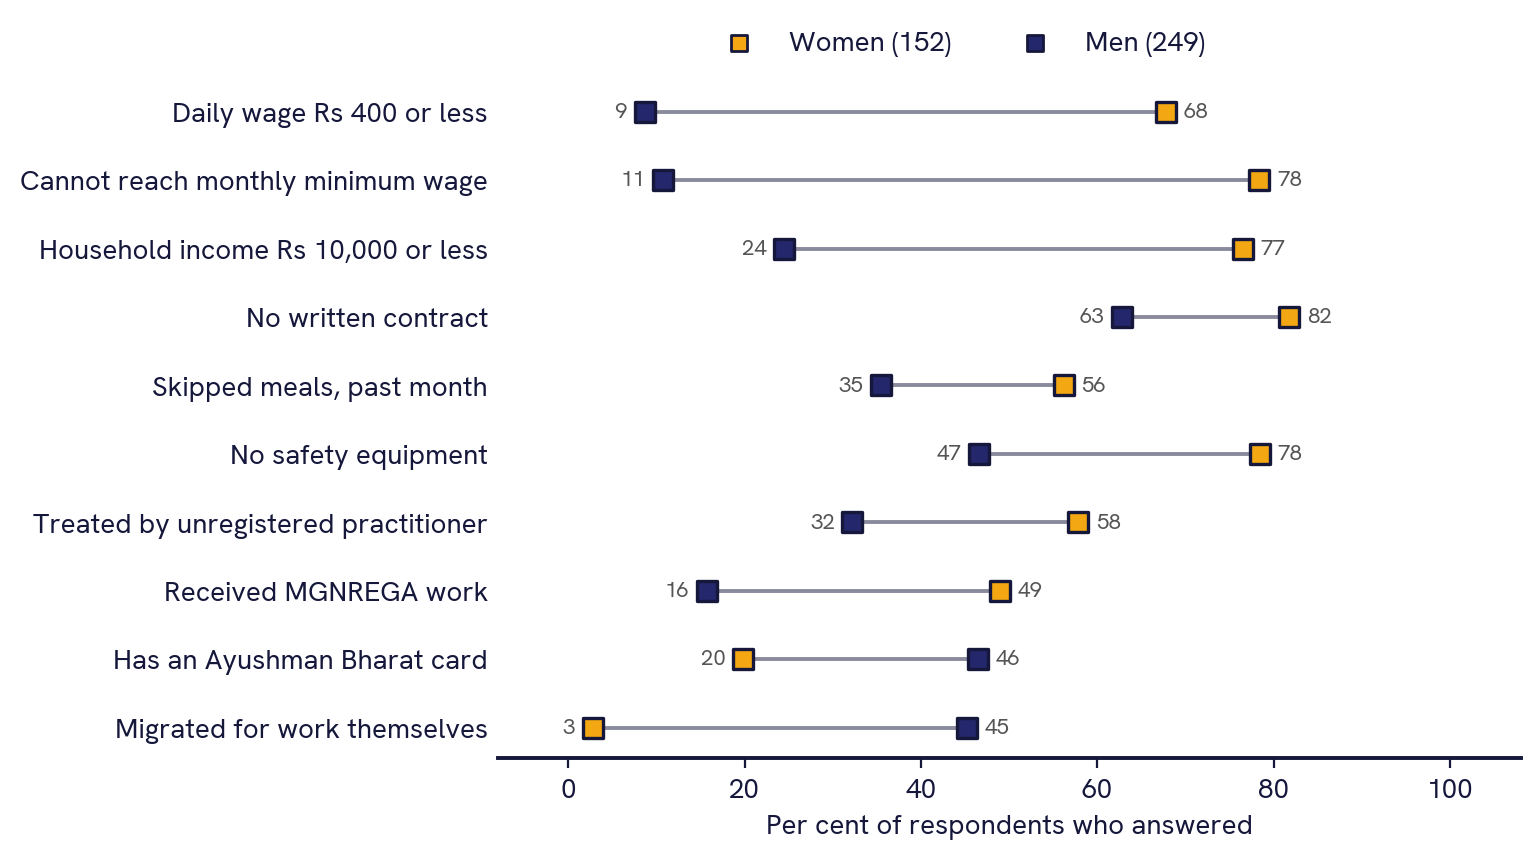
Sixty-eight per cent of women report a daily wage of Rs 400 or less, against 9 per cent of men. Seventy-eight per cent of women sit below the monthly minimum-wage ceiling, against 11 per cent of men. The difference is not an artefact of women doing different jobs: among those who describe themselves as farm or construction labourers, 65 per cent of the 99 women and 8 per cent of the 208 men fall below Rs 400 a day. In a logistic model restricted to labourers and adjusted for caste, panchayat, schooling and age, being a woman is associated with a 46.5 percentage point higher probability of falling below the monthly minimum-wage ceiling (p = 0.001, standard errors clustered on ward).
Among farm and construction labourers doing comparable work, 65 per cent of women and 8 per cent of men earn Rs 400 a day or less.
Since the Code on Wages, 2019 came into force on 21 November 2025, section 3 of that Code prohibits discrimination on the ground of gender in wages for the same work or work of a similar nature. The pattern in this sample is therefore a matter of statutory breach as well as of hardship.
One qualification belongs here rather than in a footnote. If most of these women are in part-time agricultural work, as the field team reports, then part of the daily-rate gap may reflect shorter hours rather than a lower rate for the same work, and a minimum wage is owed for a normal working day with proportionate payment below it. The survey did not record hours, so it cannot separate the two. What it can say is that the gap is far too large to be hours alone: 65 per cent of women labourers against 8 per cent of men labourers fall at or below Rs 400 a day, and the comparison holds within the same wards. Any case taken to the labour department will need hours recorded alongside employer, task, days and rate, and that is the first thing to add to the next round.
Women also depend on different parts of the state. Forty-nine per cent of women have had rural employment guarantee work, against 16 per cent of men, while 20 per cent of women hold an Ayushman Bharat card against 46 per cent of men. Three per cent of women have migrated for work themselves, against 45 per cent of men, so in many of these households the woman remains, works locally for lower pay and manages the household while the man is away. Women were also more likely to name a bribe as the reason a benefit did not reach them (28 against 17 per cent), while men far more often named missing documents (51 against 11 per cent). The national pattern reported by SBI Research, in which women are 45 per cent of underpaid casual workers while being about a quarter of that workforce, is visible here in a sharper form.
Debt, food and housing
Seventy-five per cent of households are in debt. Among borrowers, 88 per cent owe a bank or a self-help group, 9 per cent a moneylender and 2 per cent relatives. Fifty-four per cent of borrowers owe between Rs 50,000 and Rs 2 lakh and 3 per cent owe more; 18 per cent of borrowers owe above Rs 50,000 while reporting a household income of Rs 10,000 a month or less, which is at least five months of the entire household’s earnings.
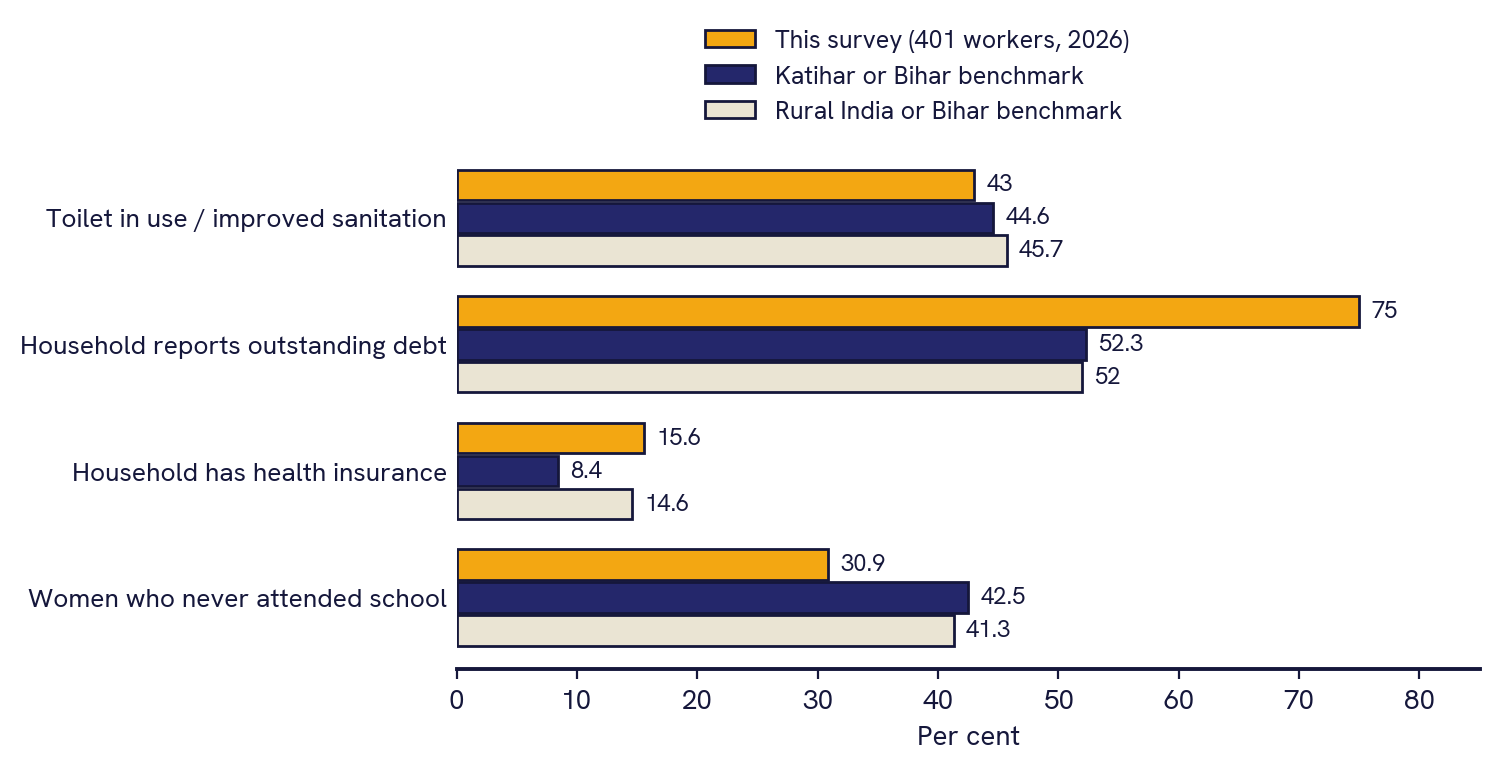
The debt figure needs a benchmark measured the same way. The All India Debt and Investment Survey of 2019 put rural indebtedness at 35 per cent, but it measured outstanding cash dues above a threshold as on 30 June 2018, which is a stricter and older test than the question asked here. Two later surveys ask what this survey asks, namely whether the household currently has outstanding debt. NABARD’s All India Rural Financial Inclusion Survey for 2021-22 found 52.0 per cent of rural households reporting outstanding debt, up from 47.4 per cent in 2016-17. The PRICE ICE 360 survey for 2021-22 found 52.3 per cent of Bihar households reporting outstanding debt. Against the like-for-like figure of about 52 per cent, this sample sits 23 points higher rather than 40 points higher, and the remaining gap is what one would expect of a group selected for being informal workers rather than of rural households in general: landless or near-landless, dependent on daily wages, and living in tolas where self-help group lending is dense.
The composition of that debt is the part this survey cannot resolve. Eighty-eight per cent of borrowers were recorded as owing a bank or self-help group, because the questionnaire placed the two in one answer category. A Jeevika group loan, a microfinance company loan and a bank loan carry different interest rates and very different consequences when a repayment is missed, and the next round must separate them.
Debt also connects to migration: of households that send someone away for work, 28 per cent named repaying a debt as a reason, after low local wages (62 per cent) and the absence of local work (46 per cent).
Forty-three per cent of respondents said the household had skipped a meal in the past month for want of money, 32 per cent once or twice and 12 per cent many times. Seventy-three per cent receive grain regularly on a ration card, 7 per cent sometimes, 4 per cent not at all, and 16 per cent have no ration card. Sixty-five per cent live in kachcha houses, and 56 per cent have no toilet in use, a figure that includes the 10 per cent who have a toilet that is not used. Three quarters draw drinking water from a public tap or handpump. The sanitation figure sits almost exactly on the NFHS-5 estimate for Katihar district, which is some reassurance that the sample, though purposive, is not unrepresentative of living conditions in the area.
Health and what it costs
When someone in the household falls ill, 42 per cent go first to an unregistered practitioner, 34 per cent to a government hospital or primary health centre and 23 per cent to a private clinic. The reliance on unregistered practitioners is higher among women (58 per cent) and among Christian respondents (84 per cent). Households that report a chronic illness behave differently: only 25 per cent of them start with an unregistered practitioner, against 45 per cent of other households. The pattern suggests a division of labour in which everyday illness is taken to the nearest available person and serious illness to a facility, which is also where the cost arises.
Seventeen per cent of households report a chronic illness. Eleven per cent spent more than Rs 30,000 on health in the past year; among households with a chronic illness the figure is 33 per cent. Applying the conservative version of the Sustainable Development Goal 3.8.2 threshold described in the methods, at least 11 per cent of households spend 10 per cent or more of their annual income on health. Because the calculation uses the bottom of the spending band and the top of the income band, the true share is higher.
Financial anxiety is widespread and unevenly distributed: 33 per cent say they are often or always worried about money and 60 per cent sometimes. In Chitoriya the “often” figure reaches 69 per cent.
Two panchayats, two regimes
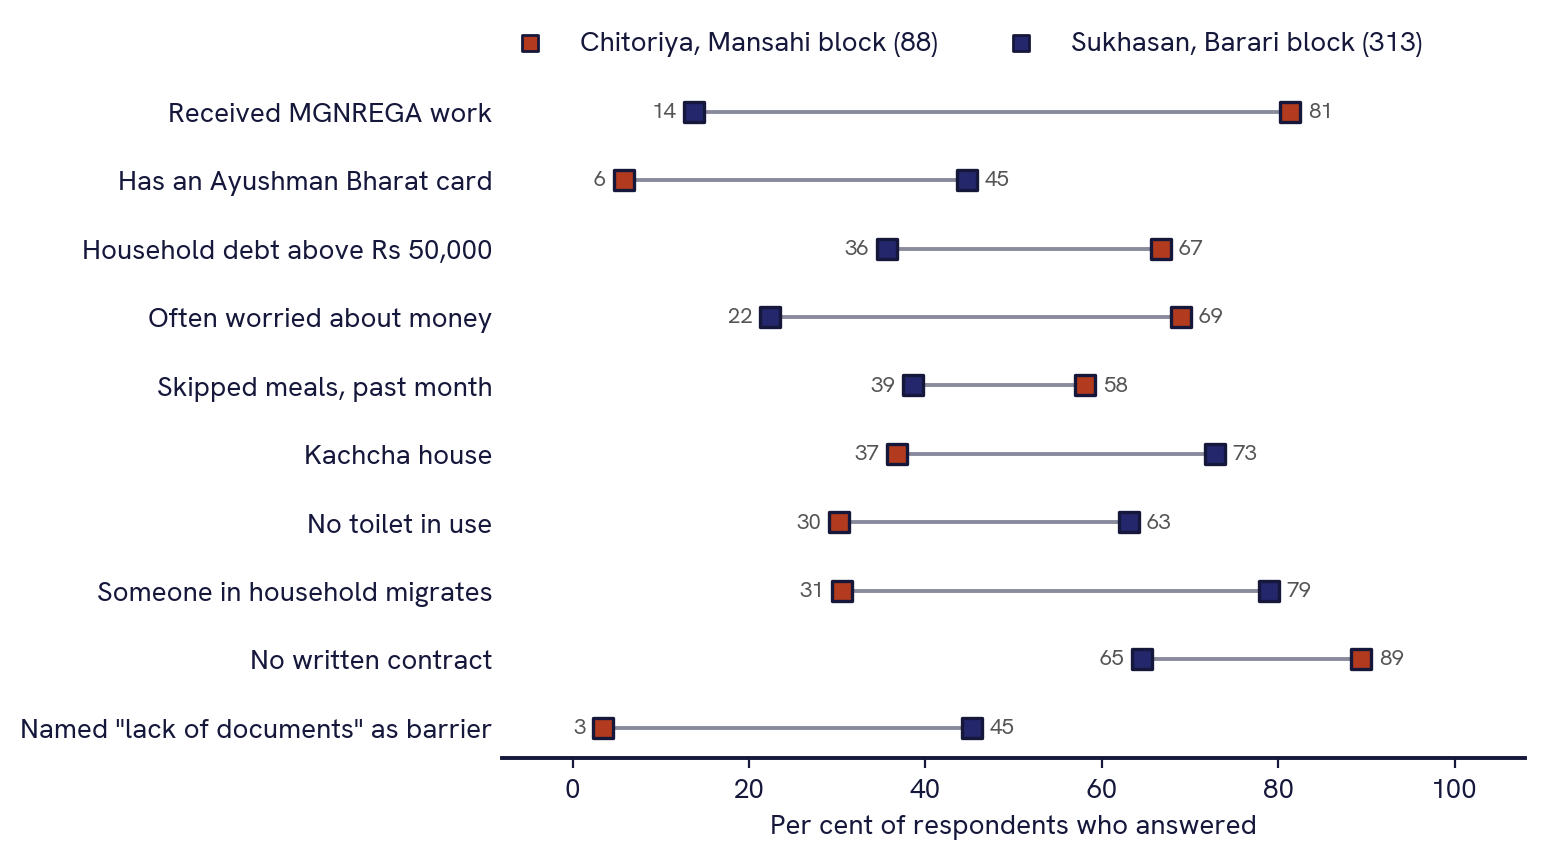
The two panchayats differ more from each other than most demographic groups within them differ. Seventy of 86 Chitoriya respondents have had rural employment guarantee work and five hold an Ayushman Bharat card. In Sukhasan the proportions are nearly reversed, at 14 and 45 per cent. Chitoriya households carry heavier debt (67 per cent owe more than Rs 50,000, against 36 per cent), report far more frequent worry about money (69 against 22 per cent) and skip more meals (58 against 39 per cent), while living in better houses with more toilets. And they stay: 31 per cent of Chitoriya households send someone away for work, against 79 per cent in Sukhasan.
A plausible reading is that local public employment has substituted for migration in Chitoriya without lifting households out of debt, because the work pays less and pays later than work in Punjab or Delhi. The survey cannot test that directly; it has no panel, no wage history and no measure of how many days of guaranteed work were actually provided. An alternative reading, that the difference is an artefact of who conducted the interviews, is weakened by the fact that the same two enumerators worked in both panchayats, though within Sukhasan the share reporting employment guarantee work ranges from 3 per cent in one team member’s interviews to 23 per cent in another’s, partly because they worked in different wards.
The policy change that fell inside the fieldwork window matters most here. The Mahatma Gandhi National Rural Employment Guarantee Act was repealed on 1 July 2026 and replaced by the Viksit Bharat Guarantee for Rozgar and Ajeevika Mission (Gramin) Act, 2025, which raises the guarantee to 125 days and sets a floor wage of Rs 300 a day, with Bihar among the states lifted to that floor. Job cards with completed e-KYC remain valid until the new Gramin Rozgar Guarantee Cards are issued. For the Chitoriya households in this sample, whether that transition is completed cleanly is the single most consequential administrative question of the coming year.
Caste, community and tola
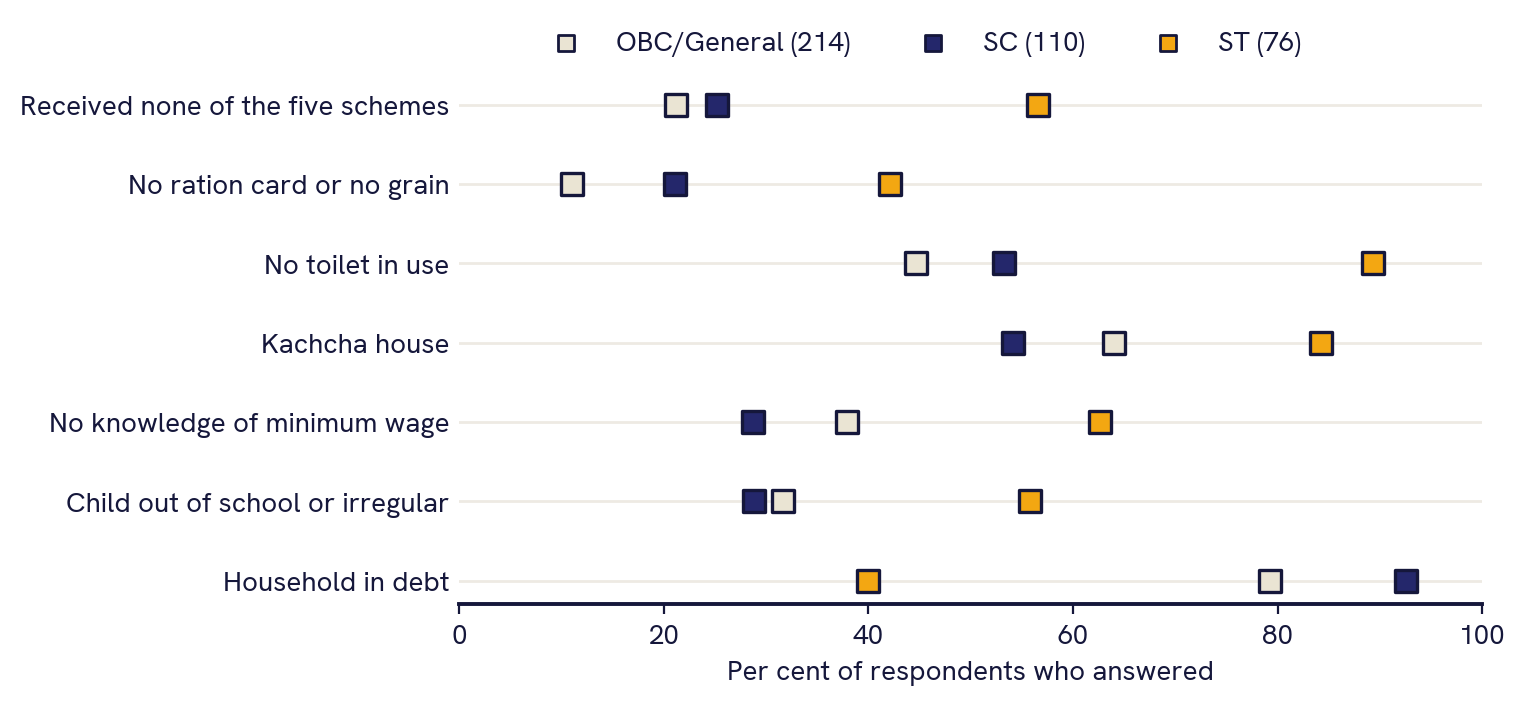
Scheduled Tribe respondents are the most excluded group in the survey, and the pattern holds across every kind of entitlement. Fifty-seven per cent have received none of the five schemes, against about a quarter of Scheduled Caste and OBC respondents. Thirty-nine per cent have no ration card. Eighty-nine per cent have no toilet in use and 84 per cent live in kachcha houses. Sixty-three per cent know nothing about minimum wages. Among those with children, 56 per cent report a child out of school or attending irregularly.
They are also the least indebted group, at 40 per cent against 79 to 93 per cent for others. Given their position on every other measure, low borrowing is better read as exclusion from self-help groups and banks than as an absence of need. The 25 Christian respondents, 22 of them Scheduled Tribe, sit at the extreme: 72 per cent have no ration card or receive no grain on it, 73 per cent have received no scheme, and 59 per cent of those who answered named a bribe as the reason. Muslim respondents, nearly all OBC and three quarters of them in ward 12, have the lowest wages of any religious group, with 67 per cent below the monthly minimum-wage ceiling against 23 per cent of Hindus, and 90 per cent of their households send someone away for work. Scheduled Caste respondents report the most debt (93 per cent) and heavy financial anxiety, and 61 of the 110 live in Chitoriya, so those two sets of findings overlap.
Two classification points come from the field team and change how these categories should be read. First, the Muslim respondents recorded here as Other Backward Classes fall, in Bihar’s own classification, under the Extremely Backward Classes. The questionnaire offered only Scheduled Caste, Scheduled Tribe, Other Backward Classes and General, so EBC households had nowhere else to go. In Bihar that distinction carries real consequences, because EBC status governs eligibility for a separate set of state schemes and reservations, and the next round must offer it as a category. Second, the Christian respondents are converts from Adivasi communities, which is consistent with 22 of the 25 being recorded as Scheduled Tribe, and they should be read as part of the Adivasi picture in this report rather than as a separate religious group with separate circumstances.
Because wards are segregated, none of these community differences can be separated from place with this design. The regression in the next section holds panchayat constant, which removes the largest geographic difference, but it cannot remove ward-level differences within Sukhasan.
Leaving to work
Sixty-eight per cent of households have at least one member who migrates for work: the respondent in 29 per cent of cases and another family member in 39 per cent. Most go once or twice a year for several months (79 per cent of migrant households), and 11 per cent are away for nearly the whole year.
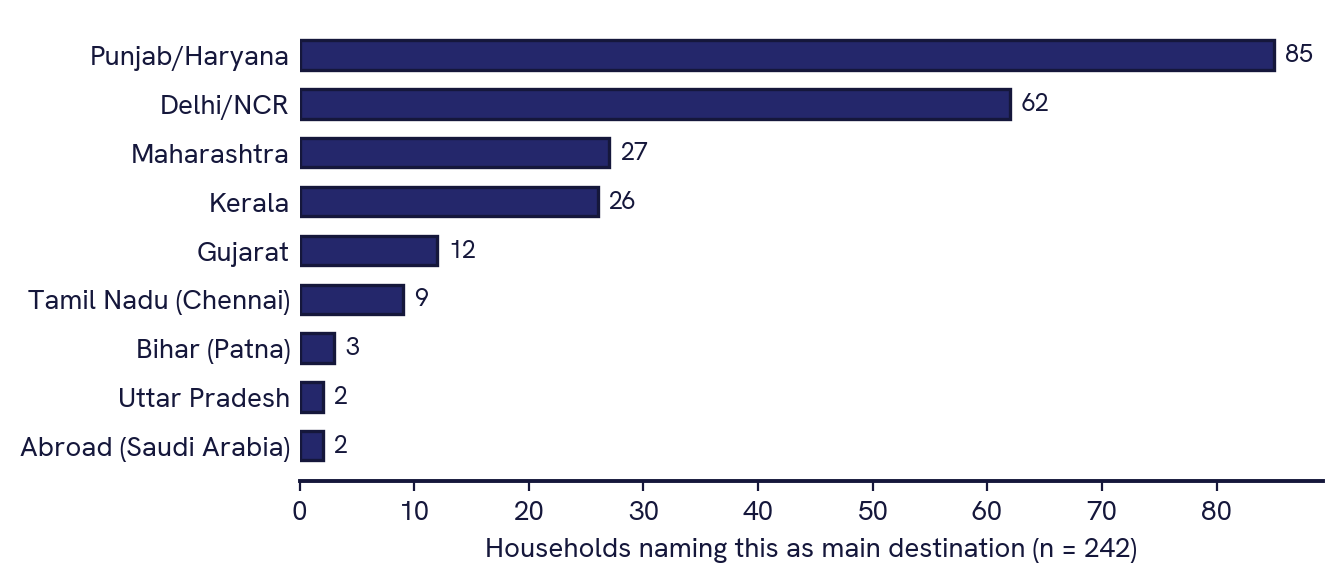
Punjab and Haryana (85 households) and Delhi (62) dominate, which matches the established pattern for Bihar, where those three states together account for about half of all migrant workers. The handwritten answers reveal a southern route that the printed options missed: 26 households named Kerala, nine named Chennai and twelve named Gujarat. Kerala’s emergence as a destination for Bihari workers is consistent with the Kerala State Planning Board estimate of 31.4 lakh migrant workers in that state, about a quarter of its workforce. More than a third of the “other” answers in this survey point to Kerala, which means it belongs on the printed list in the next round.
Migration here is not an aspiration but a wage adjustment. Asked whether they would stay if there were enough local work, 48 per cent of migrant households said yes definitely, 47 per cent said maybe, and 6 per cent said they are better off outside. The same households, writing in their own words at the end of the questionnaire, asked most often for a factory in Katihar.
What survives adjustment: regression results
The cross-tabulations above cannot tell whether, for instance, Scheduled Tribe respondents are excluded from schemes because of their social category or because they live in particular wards and work as labourers. Four logistic regressions test the main associations with the other characteristics held constant. Standard errors are clustered on ward. Full results, as odds ratios and as average marginal effects, are in Annex A3.
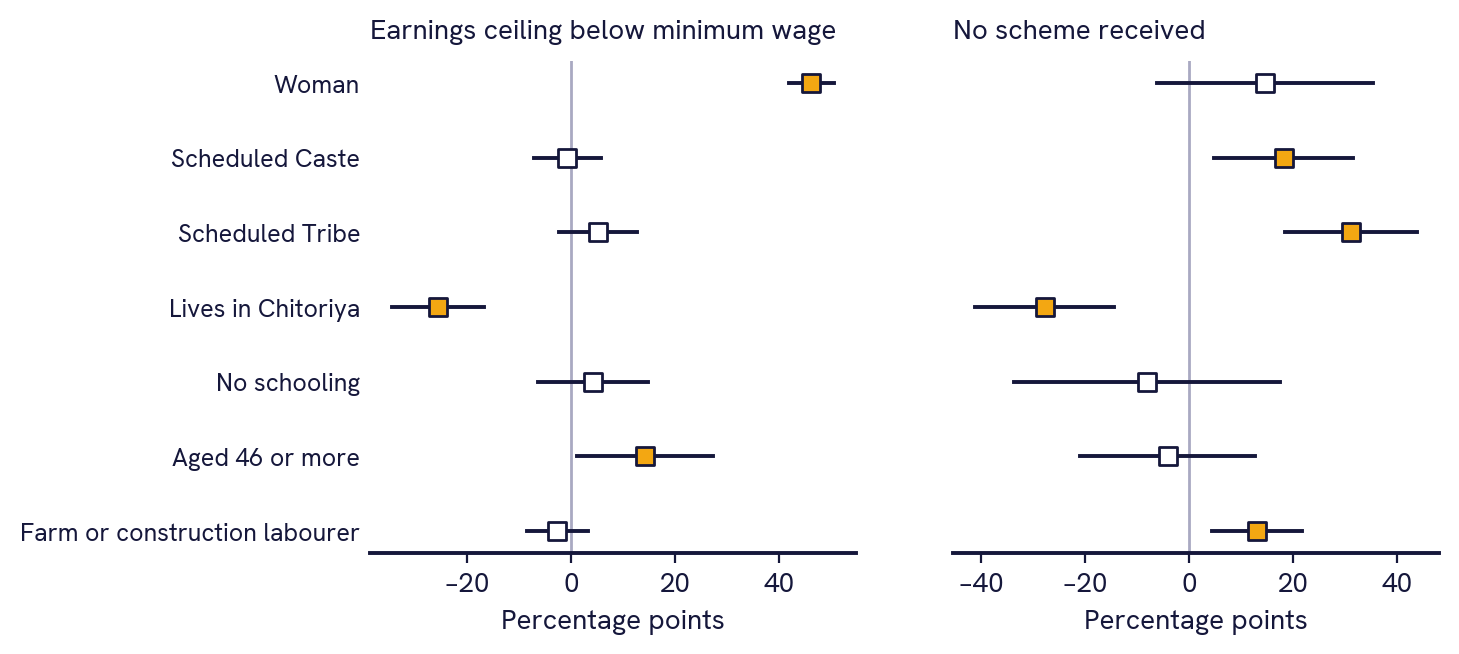
Four results are examined below. For each, the report gives the logistic average marginal effect, the ward-clustered p-value, and the wild cluster bootstrap p-value that corrects for having only nine clusters. The bootstrap is demanding at this cluster count, so the distinction between results that survive it and results that do not is reported explicitly rather than buried.
Adjusted for caste, panchayat, schooling, age and occupation, being a woman is associated with a 46.3 percentage point higher probability of falling below the monthly minimum-wage ceiling. Within labourers alone the effect is 46.5 points. The wild cluster bootstrap gives p = 0.009. Re-estimating with ward fixed effects, so that women are compared only with men of the same tola, leaves a coefficient of 62.5 points (bootstrap p = 0.028). This is the single most robust finding in the dataset: it holds within wards, within occupations, and under the most conservative inference available at this sample design.
Holding panchayat, occupation, schooling and age constant, Scheduled Tribe respondents are 31.2 points more likely than OBC respondents to have received none of the five schemes (clustered p < 0.001, bootstrap p = 0.045). The Scheduled Caste difference of 18.2 points and the labourer difference of 13.1 points point the same way but do not survive the bootstrap (p = 0.092 and p = 0.106), so they are reported here as suggestive and should not be quoted as established.
Living in Chitoriya is associated with a 46.3 point lower probability of sending a migrant, and the result survives the bootstrap (p = 0.013). The parallel scheme result, a 27.8 point lower probability of having received nothing, does not (bootstrap p = 0.148). The honest statement is therefore narrower than the raw cross-tabulation suggests: the migration difference between the two panchayats is solid, while the difference in scheme receipt, large as it looks in Figure 7, rests on a single panchayat and cannot be separated from ward-level variation with this design.
Household debt is associated with a 26.5 point higher probability of a skipped meal in the past month (clustered p = 0.001, bootstrap p = 0.031), and being a labourer with a 9.7 point increase (bootstrap p = 0.044). The caste and gender terms in the same model do not survive the bootstrap. Within this sample, borrowing is not smoothing consumption. It coexists with going without food.
Two cautions remain after all of this. The wild cluster bootstrap protects against over-confident p-values but cannot create information that nine wards do not contain, so a null here means the design cannot resolve the question rather than that no difference exists. And these are associations within a purposive sample; nothing in them identifies a causal effect.
Counting disadvantage together
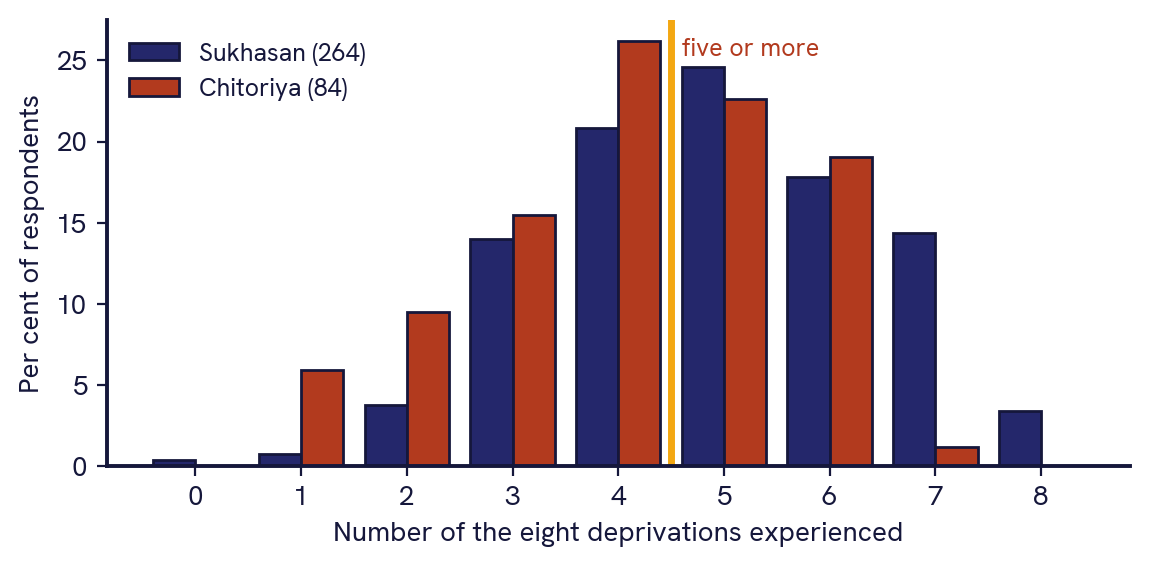
The average respondent reports 4.7 of the eight deprivations, and 56 per cent report five or more. Only one person in the 348 reports none. The distribution is unimodal and centred high, which is the statistical signature of a group facing several disadvantages simultaneously rather than a few badly-off households within a comfortable majority.
The count varies in ways the earlier sections would predict: women average 5.3 against 4.4 for men; Scheduled Tribe respondents 5.4 against 4.6 for other groups; Muslim respondents 5.5 and Christian respondents 5.3 against 4.3 for Hindu respondents. Chitoriya averages 4.1 against 4.9 for Sukhasan, a reminder that the panchayat with the worst debt and anxiety scores better on housing, sanitation and scheme receipt. For reference, the national Multidimensional Poverty Index put 44.2 per cent of Katihar’s population in multidimensional poverty in 2019-21 on a different set of indicators and a different threshold.
In their own words
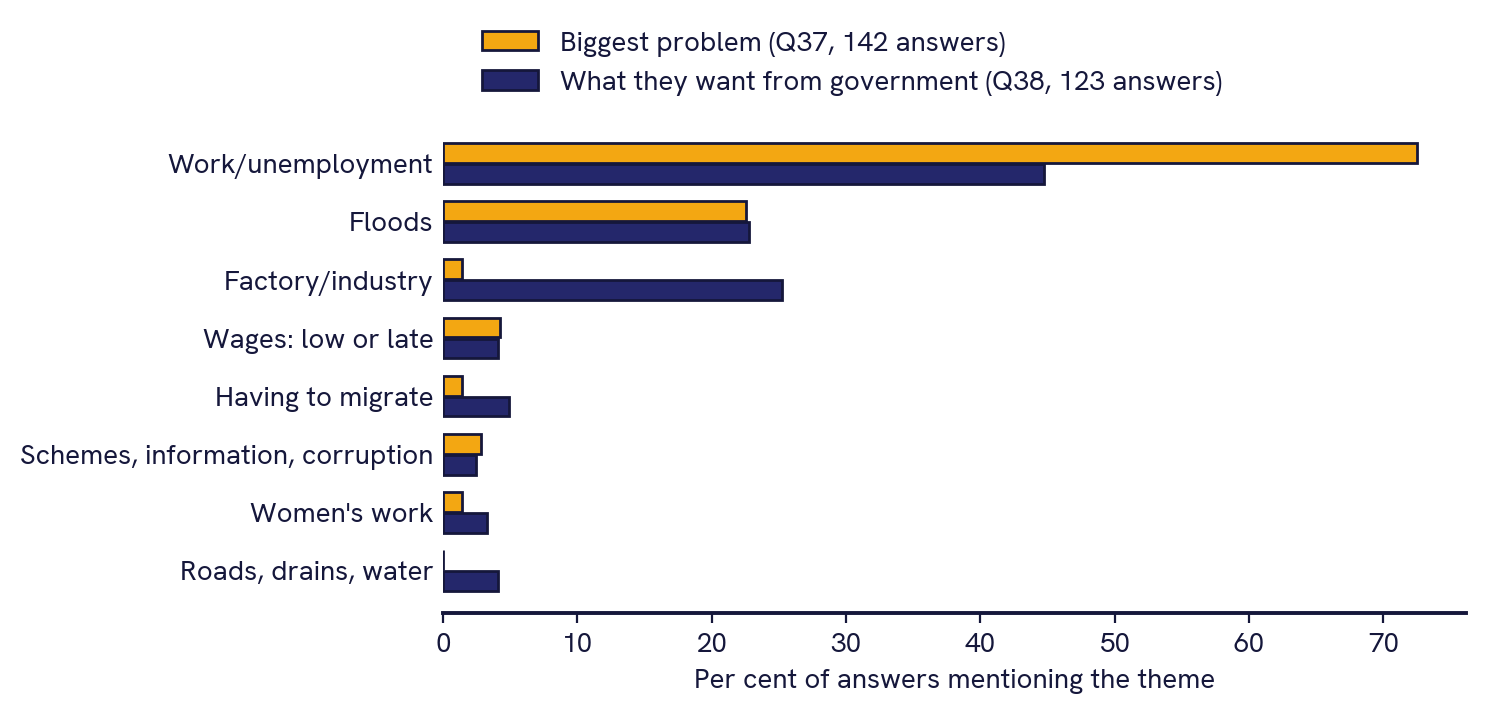
Most answers were a few words long and most were about work. Some version of “rojgar ki kami”, the shortage of employment, accounts for 72 per cent of the answers to the first question. The second theme, from 23 per cent, is flooding: “bad pani ki samasya”, the problem of flood water, and the observation that when the flood comes the house breaks. One respondent wrote that the biggest problem is having to leave the state to work. Another wrote that there is no work for women. Another, that payment comes long after the work is done.
The expectations are more concrete. A quarter asked for a factory, often specifying Katihar itself. Twenty-three per cent asked for help with floods, several of them for the same thing: raised ground where people and animals can shelter when the water rises. A few asked for roads, drains and piped water, one for faster ration cards, one for pensions. Nobody named a scheme. Asked openly what they want, these workers describe steady work near home and protection from the river, which is a different list from the one the questionnaire was built around.
Discussion
Three propositions follow from the data, in descending order of how strongly they are supported.
Policy attention to informal wages tends to focus on the rate, because the rate is what the law fixes. In this sample the rate is close to legal for most men and the shortfall comes from the number of days. Eighty-six per cent work 20 days a month or fewer, and the single largest group would earn between Rs 4,400 and Rs 12,000 in a month depending on how many days arrived. A minimum wage enforced perfectly on the days actually worked would still leave most of these households below a minimum-wage income. That is an argument for employment guarantee days and for local work creation alongside wage enforcement, and it is consistent with what respondents asked for when the questionnaire let them speak freely.
Bihar has one of the largest unorganised worker databases in the country, and 92 per cent of the labourers in this sample hold no shramik card. Thirty-six per cent of respondents hold an Ayushman Bharat card, and seven in ten of them do not know it is health insurance. The chain from eligibility to use breaks at several points, and the breaks are not where the administrative record would suggest. An organisation with limited resources will achieve more by working on documents, registration and explanation than by generating demand for schemes people already nominally hold.
The largest adjusted difference in the dataset after gender is between two panchayats of the same district: a 46 point gap in the probability of sending a migrant, which survives the bootstrap. The parallel gap in scheme receipt is of similar size in the raw data but does not survive, because with one panchayat on each side of the comparison the design cannot separate place from everything else that is particular to it. The defensible claim is therefore the first: local employment conditions, not household characteristics, explain who leaves. The second claim, that administrative performance differs sharply between neighbouring panchayats, is consistent with the data and consistent with the open answers, but this survey cannot establish it. Testing it would need several panchayats on each side.
A fourth observation is harder to place but deserves recording. Debt in this sample is overwhelmingly institutional, reported by 88 per cent of borrowers as bank or self-help group lending, and it travels with hunger rather than with protection from it. That is not an argument against microfinance, which this survey cannot evaluate, but it is a reason to measure its terms directly in the next round.
Limitations
The sample is purposive. Respondents were chosen by the field team in wards where the organisation works, so the results describe those 401 people and support no inference to Katihar, to Seemanchal or to Bihar. Confidence intervals are reported for orientation and rest on an assumption that does not hold here.
Community and place are confounded by design. Wards are segregated, so every comparison between castes or religions is also a comparison between tolas, and the data cannot separate them.
Fieldwork ran from late May to late September, which is the monsoon and flood season and the lean season for farm labour. Questions about days of work in a month will reflect that. A round in the rabi season would very likely find more days and might find different wages. All Chitoriya interviews fall in August and September, so panchayat differences are partly season differences.
Most answers are bands rather than numbers, which rules out means, medians and the usual distributional statistics, and forces the ceiling and floor constructions used here. Income, wages, debt and health spending are self-reported, unverified and subject to recall error, and in low-income survey work expenditure and income are commonly understated. One respondent answered for the whole household, so intra-household variation is invisible.
Thirty-two names recur across 66 records. To judge whether a repeat is one person entered twice, each later record was compared with the first record of that name, question by question, against a benchmark drawn from the data itself: two unrelated people in the same ward, of the same sex and social category, give identical answers on a median 63 per cent of questions, and one pair in twenty matches at 82 per cent or above. Four pairs match at 82 to 89 per cent and remain unresolved pending a check of the paper forms. The rest match at 39 to 75 per cent, which is indistinguishable from unrelated neighbours. All 401 records are retained in the main analysis; two sensitivity runs, dropping the four high-match later records and then all 34 later records of repeated names, move no headline figure by more than two percentage points (Annex A2).
Clustering is handled rather than assumed away. With nine wards, conventional cluster-robust p-values are too small, so every significance claim in section 14 is re-tested with a wild cluster restricted bootstrap and the gender result is additionally estimated within wards. Four findings survive that treatment and are reported as robust; several others do not and are reported as suggestive. The cost of this conservatism is power: a null in Annex A5 means the design cannot resolve the question, not that the difference is absent.
Finally, these are cross-sectional associations. The models adjust for observed characteristics only, and unobserved differences between households and between tolas remain. They do not identify causal effects, and the report avoids causal language about them.
What follows for practice and policy
The recommendations below are ordered by how strongly the data support them and how far they lie within the reach of a district-level organisation.
1. Treat shramik registration as the first task. Ninety-two per cent of labourers hold no card, and in Sukhasan the barrier people name most often is missing documents (45 per cent). Document camps that correct Aadhaar, bank and age records before a registration drive are likely to outperform awareness meetings. Registration should distinguish e-Shram from the construction workers’ welfare board, since the entitlements differ.
2. Explain the cards people already hold. Seven in ten Ayushman Bharat card holders do not know they are insured, and 42 per cent of households go first to an unregistered practitioner. A short household visit explaining what the card covers and which hospitals are empanelled is cheap and directly testable: record card knowledge before and after, and treatment-seeking six months later.
3. Document women’s wages as legal cases. Two thirds of women labourers report rates at or below Rs 400 against a statutory minimum of Rs 436, and the gap within the same occupation is 46 percentage points on the monthly ceiling measure. Case files recording employer, task, days and rate would give the organisation something to take to the labour department under the Code on Wages.
4. Build a separate plan for Scheduled Tribe households in wards 17 and 20. They are 31 points more likely than OBC respondents to have received nothing, adjusted for everything else, and they are furthest from ration cards, toilets and schooling. A general drive will not close that gap at the same rate.
5. Follow the Chitoriya households through the change in the employment guarantee law. They depend on that work more than anyone else in the sample, carry the heaviest debt and report the most financial anxiety. Tracking card conversion and whether the Rs 300 rate is actually paid, month by month, is a concrete monitoring task with a clear success measure.
6. Record flood damage. Floods were raised by 23 per cent of those who answered the open questions, although the questionnaire never asked about them. One or two questions in the next round would convert a widely felt problem into evidence.
7. For district administration and policy audiences, the firmest finding is that the chain from registration to understanding breaks at the explanation stage rather than at enrolment: cards are in houses whose occupants do not know what they do. A second pattern, that neighbouring panchayats differ sharply in what reaches people, is visible in the data but not established by it, and a survey covering several panchayats on each side would settle whether local delivery capacity is the binding constraint.
Designing the next round
Draw respondents from a defined frame, such as the organisation’s own beneficiary list or a ward voter list, so that results describe a known population and sampling error can be estimated honestly.
Ask for actual days worked last month and the actual daily wage as numbers rather than bands. That single change would replace every ceiling and floor construction in this report with a direct estimate, and would allow the shortfall from the minimum wage to be quantified in rupees.
Add Extremely Backward Classes as a social category, since Bihar’s classification separates it from Other Backward Classes and most Muslim respondents in this sample belong to it. Record hours worked as well as days, so that daily rates can be compared on a like basis between women and men. Align the occupation categories with the field team’s own definitions, in which domestic work covers work in other people’s homes, part-time agricultural work and housework. Split the debt question into bank, Jeevika or other self-help group, microfinance company and moneylender, and ask the interest rate and the repayment period. Separate the e-Shram card from the construction workers’ board card. Ask the barrier question scheme by scheme. Add household size, so that income can be expressed per head. Add a flood module. Put Kerala and Tamil Nadu on the printed list of migration destinations. Record the guardian’s name from the first interview, as the current form now does, and record consent explicitly.
Finally, plan a second round in the rabi season. The strongest single claim in this report, that most of these workers cannot assemble a minimum-wage month, would become far more secure with a dry-season comparison.
References
Act Now India (2026). Shramik survey, Katihar. KoboToolbox form, 401 submissions, 27 May to 20 September 2026. Anonymised dataset and cleaning log published with this report.
Breman, J. (1996). Footloose Labour: Working in India’s Informal Economy. Cambridge University Press.
Cameron, A. C., Gelbach, J. B. and Miller, D. L. (2008). Bootstrap-based improvements for inference with clustered errors. Review of Economics and Statistics, 90(3), 414-427. Method used for the wild cluster bootstrap in Annex A5.
Centre for Development Policy and Management, IIM Udaipur (2025). How do households in Bihar manage spending, debt and aspirations? Using PRICE ICE 360 survey data for 2021-22; 52.3 per cent of Bihar households report outstanding debt. https://cdpm.iimu.ac.in/wp-content/uploads/2025/10/How-Do-Households-in-Bihar-Manage-Spending-Debt-and-Aspirations_A-Report-1.pdf
Government of Bihar, Labour Resources Department (2025). Revision of minimum wages and variable dearness allowance, notified 24 September 2025, effective 1 April to 30 September 2026 for all 89 scheduled employments. Unskilled: basic Rs 428 plus VDA Rs 8, total Rs 436 per day and Rs 11,336 per month of 26 days. Rates verified against four independent compliance summaries of the notification, which agree on every figure.
Government of Bihar (2026). Code on Wages (Bihar) Rules, 2026, notified July 2026, replacing the Bihar Minimum Wages Rules, 1951 and the Bihar Payment of Wages Rules, 1937. Rule 5 requires variable dearness allowance revision before 1 April and 1 October each year, and bars state rates below the central floor wage.
NABARD (2024). All India Rural Financial Inclusion Survey (NAFIS) 2021-22. Proportion of rural households reporting outstanding debt: 52.0 per cent, against 47.4 per cent in 2016-17.
Government of India, Ministry of Finance (2019). Economic Survey 2018-19, Volume 1, Chapter 11: Redesigning a minimum wage system in India for inclusive growth. https://www.indiabudget.gov.in/budget2019-20/economicsurvey/doc/vol1chapter/echap11_Vol1.pdf
Government of India, Ministry of Home Affairs (2011). Census of India 2011, district profile, Katihar.
Government of India, Ministry of Labour and Employment (2026). e-Shram portal: registrations by state. Press Information Bureau releases of 2 February 2026 and August 2026; Bihar approximately 3.24 crore registrations.
Government of India, Ministry of Rural Development (2026). Notified wage rates under the Viksit Bharat Guarantee for Rozgar and Ajeevika Mission (Gramin) Act, 2025. Press Information Bureau, 30 June 2026. The Act commenced on 1 July 2026 and repealed the Mahatma Gandhi National Rural Employment Guarantee Act, 2005.
Government of India, Ministry of Statistics and Programme Implementation (2021). All India Debt and Investment Survey 2019, NSS 77th round, Report No. 588. Press note of 24 August 2021. https://www.mospi.gov.in/sites/default/files/press_release/press_note-AIDIS-240821.pdf
Government of India, Ministry of Statistics and Programme Implementation (2024). Periodic Labour Force Survey, Annual Report July 2023 to June 2024. State-level casual wage figures for Bihar from the published quarterly series.
Harriss-White, B. (2003). India Working: Essays on Society and Economy. Cambridge University Press.
International Institute for Population Sciences (2021). National Family Health Survey (NFHS-5) 2019-21: Bihar state and Katihar district fact sheets. http://rchiips.org/nfhs/
Kerala State Planning Board (2021). Study of domestic migrant workers in Kerala by J. K. Parida and K. Raviraman, estimating 31.4 lakh migrant workers, about 26 per cent of the state workforce.
National Commission for Enterprises in the Unorganised Sector (2007). Report on Conditions of Work and Promotion of Livelihoods in the Unorganised Sector. Government of India.
NITI Aayog (2023). National Multidimensional Poverty Index: A Progress Review 2023. Katihar headcount ratio 62.38 per cent in 2015-16 and 44.21 per cent in 2019-21. https://www.niti.gov.in/sites/default/files/2023-08/India-National-Multidimentional-Poverty-Index-2023.pdf
Rodgers, G. and others (2020). Circular migration and precarity: perspectives from rural Bihar. Published open access; reports that Punjab, Delhi and Haryana account for about half of migrant workers from Bihar. https://pmc.ncbi.nlm.nih.gov/articles/PMC7659404
SBI Research (2026). Analysis of Periodic Labour Force Survey 2025 data on minimum wage compliance among casual workers. https://sbi.bank.in
Soundararajan, V. (2019). Heterogeneous effects of imperfectly enforced minimum wages in low-wage labor markets. Journal of Development Economics, 140, 355-374.
Study of awareness of Ayushman Bharat-Pradhan Mantri Jan Arogya Yojana in a rural community in eastern India (2023). Cureus. Reports awareness of 68.6 per cent, card possession of 58 per cent among eligible and aware respondents, and utilisation of 1.3 per cent in rural Bihar. https://pmc.ncbi.nlm.nih.gov/articles/PMC10081073/
World Development (2021). Minimum wage compliance and household welfare: an analysis of over 1500 minimum wages in India. Volume 147. https://www.sciencedirect.com/science/article/pii/S0305750X21002680
World Health Organization and World Bank. Sustainable Development Goal indicator 3.8.2: proportion of population with large household expenditure on health as a share of total household expenditure or income, thresholds of 10 and 25 per cent.
Annex
| Indicator | Share | Count | 95% interval |
|---|---|---|---|
| Work 20 days a month or fewer | 86% | 338 of 394 | 82 to 89 |
| Daily wage Rs 400 or less | 31% | 122 of 391 | 27 to 36 |
| Cannot reach monthly minimum wage even at top of their bands | 36% | 142 of 389 | 32 to 41 |
| Wages paid late | 84% | 330 of 391 | 80 to 88 |
| Never had a written contract | 70% | 271 of 387 | 65 to 74 |
| Household in debt | 75% | 294 of 390 | 71 to 79 |
| Debt above Rs 50,000 | 43% | 166 of 390 | 38 to 48 |
| Skipped meals for lack of money (past month) | 43% | 161 of 374 | 38 to 48 |
| Kachcha house | 65% | 260 of 400 | 60 to 70 |
| No toilet in use | 56% | 216 of 387 | 51 to 61 |
| Back or joint pain from work | 74% | 287 of 390 | 69 to 78 |
| Usually treated by unregistered practitioner | 42% | 163 of 389 | 37 to 47 |
| Health spending at least 10% of income (lower bound) | 11% | 42 of 379 | 8 to 15 |
| Often worried about money | 33% | 128 of 391 | 28 to 38 |
| No safety equipment at work | 59% | 223 of 380 | 54 to 64 |
| Received none of the five schemes | 29% | 114 of 392 | 25 to 34 |
| Has an Ayushman Bharat card | 36% | 142 of 392 | 32 to 41 |
| Received MGNREGA work | 29% | 112 of 392 | 24 to 33 |
| Has a shramik card | 8% | 32 of 392 | 6 to 11 |
| No knowledge of minimum wage/rights | 40% | 157 of 390 | 36 to 45 |
| Someone in household migrates for work | 68% | 247 of 365 | 63 to 72 |
Wilson score intervals. They assume random selection, which did not occur, and are reported for orientation only. Definitions of the constructed measures are in section 4.
| Indicator | All 401 | Without 4 high-match | Without all 34 later |
|---|---|---|---|
| Work 20 days a month or fewer | 85.8 | 85.6 | 85.8 |
| Daily wage Rs 400 or less | 31.2 | 31.5 | 32.1 |
| Cannot reach monthly minimum wage even at top of their bands | 36.5 | 36.9 | 37.1 |
| Wages paid late | 84.4 | 84.2 | 84.6 |
| Never had a written contract | 70.0 | 70.8 | 70.8 |
| Household in debt | 75.4 | 75.4 | 74.7 |
| Debt above Rs 50,000 | 42.6 | 42.2 | 43.0 |
| Skipped meals for lack of money (past month) | 43.0 | 43.5 | 44.3 |
| Kachcha house | 65.0 | 65.4 | 66.7 |
| No toilet in use | 55.8 | 56.2 | 56.3 |
| Back or joint pain from work | 73.6 | 73.6 | 74.9 |
| Usually treated by unregistered practitioner | 41.9 | 42.3 | 43.9 |
| Health spending at least 10% of income (lower bound) | 11.1 | 11.2 | 11.4 |
| Often worried about money | 32.7 | 33.1 | 32.2 |
| No safety equipment at work | 58.7 | 59.3 | 59.9 |
| Received none of the five schemes | 29.1 | 29.4 | 29.9 |
| Has an Ayushman Bharat card | 36.2 | 35.6 | 35.8 |
| Received MGNREGA work | 28.6 | 28.6 | 27.9 |
| Has a shramik card | 8.2 | 8.2 | 7.8 |
| No knowledge of minimum wage/rights | 40.3 | 40.7 | 40.7 |
| Someone in household migrates for work | 67.7 | 67.7 | 67.7 |
Column three drops the later record of the four pairs matching on 80 per cent or more of answered fields. Column four drops the later record of every repeated name: 34 records across 32 name groups, two names occurring three times.
EARNINGS CEILING BELOW MONTHLY MINIMUM WAGE
| Variable | Odds ratio | 95% interval | p |
|---|---|---|---|
| Woman | 115.59 | 10.40 to 1284.30 | 0.000 |
| Scheduled Caste | 0.93 | 0.49 to 1.78 | 0.831 |
| Scheduled Tribe | 1.71 | 0.69 to 4.25 | 0.247 |
| Lives in Chitoriya | 0.07 | 0.02 to 0.35 | 0.001 |
| No schooling | 1.56 | 0.52 to 4.71 | 0.431 |
| Aged 46 or more | 4.35 | 1.00 to 19.01 | 0.051 |
| Farm or construction labourer | 0.77 | 0.40 to 1.46 | 0.419 |
n = 388, events = 142, McFadden pseudo R-squared = 0.502. Standard errors clustered on nine wards.
RECEIVED NONE OF THE FIVE SCHEMES
| Variable | Odds ratio | 95% interval | p |
|---|---|---|---|
| Woman | 2.29 | 0.55 to 9.60 | 0.257 |
| Scheduled Caste | 2.81 | 1.06 to 7.46 | 0.038 |
| Scheduled Tribe | 5.88 | 2.13 to 16.19 | 0.001 |
| Lives in Chitoriya | 0.21 | 0.11 to 0.39 | 0.000 |
| No schooling | 0.63 | 0.15 to 2.72 | 0.539 |
| Aged 46 or more | 0.79 | 0.32 to 1.96 | 0.614 |
| Farm or construction labourer | 2.10 | 1.19 to 3.69 | 0.010 |
n = 391, events = 114, McFadden pseudo R-squared = 0.122. Standard errors clustered on nine wards.
HOUSEHOLD SENDS A MIGRANT
| Variable | Odds ratio | 95% interval | p |
|---|---|---|---|
| Woman | 0.79 | 0.29 to 2.12 | 0.636 |
| Scheduled Caste | 2.33 | 1.31 to 4.14 | 0.004 |
| Scheduled Tribe | 0.57 | 0.13 to 2.52 | 0.458 |
| Lives in Chitoriya | 0.07 | 0.03 to 0.14 | 0.000 |
| No schooling | 0.90 | 0.50 to 1.63 | 0.734 |
| Aged 46 or more | 1.17 | 0.81 to 1.70 | 0.401 |
| Farm or construction labourer | 1.25 | 0.61 to 2.55 | 0.539 |
| Debt above Rs 50,000 | 0.74 | 0.46 to 1.18 | 0.204 |
n = 360, events = 242, McFadden pseudo R-squared = 0.17. Standard errors clustered on nine wards.
SKIPPED MEALS IN THE PAST MONTH
| Variable | Odds ratio | 95% interval | p |
|---|---|---|---|
| Woman | 2.68 | 0.78 to 9.24 | 0.119 |
| Scheduled Caste | 1.96 | 0.78 to 4.92 | 0.154 |
| Scheduled Tribe | 2.26 | 0.96 to 5.33 | 0.062 |
| Lives in Chitoriya | 0.94 | 0.36 to 2.45 | 0.895 |
| No schooling | 1.04 | 0.56 to 1.91 | 0.906 |
| Aged 46 or more | 1.60 | 0.80 to 3.19 | 0.186 |
| Farm or construction labourer | 1.57 | 1.19 to 2.07 | 0.001 |
| Household in debt | 3.42 | 1.82 to 6.42 | 0.000 |
n = 367, events = 159, McFadden pseudo R-squared = 0.095. Standard errors clustered on nine wards.
EARNINGS CEILING BELOW MINIMUM WAGE
| Variable | Effect (pp) | Standard error | p |
|---|---|---|---|
| Woman | +46.3 | 2.2 | 0.000 |
| Scheduled Caste | -0.7 | 3.3 | 0.836 |
| Scheduled Tribe | +5.2 | 3.8 | 0.163 |
| Lives in Chitoriya | -25.6 | 4.5 | 0.000 |
| No schooling | +4.3 | 5.4 | 0.427 |
| Aged 46 or more | +14.3 | 6.7 | 0.033 |
| Farm or construction labourer | -2.6 | 3.0 | 0.397 |
NO SCHEME RECEIVED
| Variable | Effect (pp) | Standard error | p |
|---|---|---|---|
| Woman | +14.6 | 10.6 | 0.170 |
| Scheduled Caste | +18.2 | 6.8 | 0.008 |
| Scheduled Tribe | +31.2 | 6.5 | 0.000 |
| Lives in Chitoriya | -27.8 | 6.8 | 0.000 |
| No schooling | -8.1 | 13.1 | 0.540 |
| Aged 46 or more | -4.1 | 8.6 | 0.632 |
| Farm or construction labourer | +13.1 | 4.4 | 0.003 |
HOUSEHOLD SENDS A MIGRANT
| Variable | Effect (pp) | Standard error | p |
|---|---|---|---|
| Woman | -4.1 | 8.6 | 0.630 |
| Scheduled Caste | +14.6 | 7.1 | 0.039 |
| Scheduled Tribe | -9.8 | 12.0 | 0.417 |
| Lives in Chitoriya | -46.3 | 3.8 | 0.000 |
| No schooling | -1.8 | 5.2 | 0.733 |
| Aged 46 or more | +2.8 | 3.4 | 0.423 |
| Farm or construction labourer | +3.9 | 6.2 | 0.535 |
| Debt above Rs 50,000 | -5.3 | 4.1 | 0.197 |
SKIPPED MEALS
| Variable | Effect (pp) | Standard error | p |
|---|---|---|---|
| Woman | +21.2 | 11.7 | 0.070 |
| Scheduled Caste | +14.5 | 10.2 | 0.155 |
| Scheduled Tribe | +17.6 | 9.0 | 0.050 |
| Lives in Chitoriya | -1.4 | 10.7 | 0.896 |
| No schooling | +0.8 | 6.6 | 0.905 |
| Aged 46 or more | +10.1 | 7.2 | 0.160 |
| Farm or construction labourer | +9.7 | 2.5 | 0.000 |
| Household in debt | +26.5 | 8.1 | 0.001 |
Effects are averaged over the sample. Positive values mean a higher probability of the outcome named in the panel title.
| Model | Variable | Effect (pp) | t | Bootstrap p |
|---|---|---|---|---|
| Earnings ceiling below minimum wage | Woman | +72.2 | 6.09 | 0.009 |
| Earnings ceiling below minimum wage | Scheduled Tribe | +4.4 | 0.99 | 0.410 |
| Earnings ceiling below minimum wage | Lives in Chitoriya | -30.5 | -5.79 | 0.073 |
| Received no scheme | Woman | +13.8 | 1.32 | 0.486 |
| Received no scheme | Scheduled Caste | +17.3 | 2.75 | 0.091 |
| Received no scheme | Scheduled Tribe | +36.9 | 4.38 | 0.044 |
| Received no scheme | Lives in Chitoriya | -24.6 | -3.78 | 0.147 |
| Received no scheme | Farm or construction labourer | +13.2 | 2.94 | 0.105 |
| Household sends a migrant | Scheduled Caste | +12.0 | 1.72 | 0.363 |
| Household sends a migrant | Lives in Chitoriya | -54.3 | -8.69 | 0.013 |
| Skipped meals | Woman | +21.9 | 1.72 | 0.342 |
| Skipped meals | Scheduled Tribe | +16.4 | 1.82 | 0.295 |
| Skipped meals | Farm or construction labourer | +9.6 | 3.75 | 0.043 |
| Skipped meals | Household in debt | +24.5 | 2.59 | 0.031 |
| Ward fixed effects, earnings ceiling | Woman | +62.5 | 3.41 | 0.028 |
Linear probability models matching the logistic specifications, with a wild cluster restricted bootstrap using Rademacher weights, 1,999 replications, clustered on nine wards. Coefficients are in percentage points and differ from the logistic marginal effects because the linear model extrapolates outside the zero-to-one range. The final row is the ward fixed effects specification of the gender result. Bootstrap p-values at or below 0.05 are treated as robust in the text.
| Step | Rule applied | Records |
|---|---|---|
| Standardise | Enumerator names: 9 spellings collapsed to 5 people ('Md' taken as Md Habib, marked probable) | 204 |
| Fix contradiction | q9: 'none of these' ticked together with a specific option; kept the specific option(s), removed 'none' | 3 |
| Fix contradiction | q14: 'none of these' ticked together with a specific option; kept the specific option(s), removed 'none' | 8 |
| Fix contradiction | q23: 'none of these' ticked together with a specific option; kept the specific option(s), removed 'none' | 13 |
| Flag | Paper ID 25 appears on two different respondents and ID 26 is absent | 2 |
| Flag | Q27 (migration) blank but Q28-Q31 answered | 1 |
| Flag | Debt reported but Q11 (amount) blank | 1 |
| Flag | Same (normalised) name appears more than once: 32 names, 66 records | 66 |
| Flag | Of these, later records matching >=80% (papers 158, 153, 165, 164) | 4 |
| Standardise | Q30 'Other' destination: free text spellings grouped (e.g. Kerala/Kerela/केरल) | 60 |
| Code | Q37 and Q38 open answers coded into 8 themes by keyword (Hindi, Hinglish, English); one answer can carry several themes | 265 |
| Remove | Direct identifiers dropped from all outputs: respondent name, father's/husband's name, verification notes that quote names | 401 |
The full log with notes, the codebook, the repeated-name table and the theme coding rules are in the accompanying spreadsheet.
The full instrument as fielded on KoboToolbox, in the order asked. Questions were read in Hindi; the English column is the label carried in the digital form. Response options are shown in English.
| Variable | Question (Hindi) | Question (English) | Type | Response options |
|---|---|---|---|---|
| entry_by | डेटा दर्ज करने वाले का नाम | Data entered by | open text | |
| survey_date | सर्वेक्षण की तारीख | Date of survey | date | |
| paper_id | कागज़ फॉर्म / उत्तरदाता आईडी (कागज़ पर लिखा नंबर) | Paper form / respondent ID | open text | |
| resp_name | नाम | Name of respondent | open text | |
| guardian | पिता / पति का नाम (एक जैसे नामों में फर्क के लिए) | Father's / husband's name (to tell same names apart) | open text | |
| gender | लिंग | Gender | one choice | Male; Female; Other |
| gp | ग्राम पंचायत | Gram Panchayat | one choice | Sukhasan; Chitoriya; Other |
| ward | वार्ड संख्या | Ward number | number | |
| address | गाँव/टोला | Village / Tola | open text | |
| age_band | उम्र | Age band | one choice | 15-25; 26-35; 36-45; 46-55; 56+ |
| religion | धर्म | Religion | one choice | Hindu; Muslim; Sikh; Christian; Other |
| category | वर्ग | Social category | one choice | SC; ST; OBC; General |
| education | शिक्षा | Education | one choice | Illiterate; Primary; Middle; Class 10; Class 12; Graduate+ |
| q1 | 1. आप मुख्य रूप से कौन सा कार्य करते हैं? | Q1 Main occupation | one choice | Labour (construction/farm); Domestic work; Street vendor/cart; Other |
| q1_other | अन्य कार्य लिखें | Other occupation | open text | |
| q2 | 2. आपके कार्य की प्रकृति क्या है? | Q2 Nature of work | one choice | Regular/permanent; Casual (as needed); Seasonal |
| q3 | 3. एक महीने में औसतन कितने दिन काम मिलता है? | Q3 Work days per month | one choice | 0-10 days; 11-20 days; 21+ days |
| q4 | 4. आपकी दैनिक मजदूरी कितनी है? | Q4 Daily wage | one choice | Below Rs 200; Rs 200-400; Rs 401-600; Above Rs 600 |
| q5 | 5. आपकी मासिक पारिवारिक आय कितनी है? | Q5 Monthly household income | one choice | Below Rs 5,000; Rs 5,001-10,000; Rs 10,001-15,000; Above Rs 15,000 |
| q6 | 6. क्या आपको समय पर मजदूरी का भुगतान मिलता है? | Q6 Wages paid on time | one choice | Yes, on time; Some delay; Often delayed months |
| q7 | 7. क्या आपको कार्यस्थल पर लिखित अनुबंध/ठेका मिलता है? | Q7 Written contract | one choice | Yes; No; Sometimes |
| q8 | 8. आपके घर का प्रकार क्या है? | Q8 House type | one choice | Pucca; Semi-pucca; Kachcha; Rented |
| q9 | 9. आपके परिवार के पास क्या है? (एक से अधिक चुन सकते हैं) | Q9 Household assets | multiple | Mobile phone; Cycle/motorcycle; Livestock; Farm land; None of these |
| q10 | 10. क्या आपके परिवार पर कोई कर्ज/ऋण है? | Q10 Household debt | one choice | No; Yes, bank/SHG; Yes, moneylender; Yes, relatives |
| q11 | 11. यदि कर्ज है, तो अनुमानित राशि कितनी है? | Q11 Debt amount | one choice | Not applicable; Below Rs 50,000; Rs 50,001-2,00,000; Above Rs 2,00,000 |
| q12 | 12. पिछले महीने में क्या कभी पैसों की कमी के कारण परिवार को भोजन छोड़ना पड़ा? | Q12 Skipped meals | one choice | No, never; Yes, 1-2 times; Yes, many times |
| q13 | 13. क्या आपको राशन कार्ड के तहत नियमित अनाज मिलता है? | Q13 Ration card grain | one choice | Yes, regular; Yes, sometimes; No; No ration card |
| q14 | 14. क्या आपके काम से कोई स्वास्थ्य समस्या हुई है? (एक से अधिक चुन सकते हैं) | Q14 Work-related health problems | multiple | No problem; Back/joint pain; Respiratory; Skin; Injury/accident; Other |
| q14_other | अन्य समस्या लिखें | Other health problem | open text | |
| q15 | 15. क्या आपके परिवार में कोई दीर्घकालिक/गंभीर बीमारी (TB, मधुमेह, हृदय रोग आदि) से पीड़ित है? | Q15 Chronic illness in family | one choice | No; Yes |
| q16 | 16. बीमार पड़ने पर आप कहाँ इलाज कराते हैं? | Q16 Where treated | one choice | Govt hospital/PHC; Private hospital/clinic; Unregistered practitioner; No treatment |
| q17 | 17. पिछले एक वर्ष में परिवार का स्वास्थ्य पर अनुमानित खर्च कितना रहा? | Q17 Annual health spend | one choice | Below Rs 2,000; Rs 2,001-10,000; Rs 10,001-30,000; Above Rs 30,000 |
| q18 | 18. क्या आपके घर में शौचालय है? | Q18 Toilet | one choice | Yes, in use; Yes, but unused; No |
| q19 | 19. पीने के पानी का मुख्य स्रोत क्या है? | Q19 Drinking water source | one choice | Tap at home; Public tap/handpump; Well/pond |
| q20 | 20. पिछले महीने में आप कितनी बार अपनी आर्थिक स्थिति को लेकर बहुत चिंतित या तनावग्रस्त रहे? | Q20 Financial stress | one choice | Never/rarely; Sometimes; Often/always |
| q21 | 21. क्या कार्यस्थल पर सुरक्षा उपकरण (मास्क, दस्ताने, हेलमेट आदि) मिलते हैं? | Q21 Safety equipment | one choice | Yes, all provided; Some provided; Not at all |
| q22 | 22. कार्यस्थल पर दुर्घटना होने पर क्या कोई मुआवजा मिलता है? | Q22 Accident compensation | one choice | Yes; No; Sometimes |
| q23 | 23. निम्नलिखित में से किन योजनाओं का लाभ आपको वास्तव में मिला है? (एक से अधिक चुन सकते हैं) | Q23 Schemes actually benefited from | multiple | MGNREGA; Ayushman Bharat/PMJAY; Shramik card; PM Shram Yogi Maandhan; Kushal Yuva/skill training; None of these |
| q24 | 24. क्या आपके पास कोई बीमा (सरकारी या निजी) है? | Q24 Insurance | one choice | Yes; No; Don't know |
| q25 | 25. यदि आपने किसी योजना के लिए आवेदन किया लेकिन लाभ नहीं मिला, तो मुख्य कारण क्या था? | Q25 Why benefit not received | one choice | Not applicable; Lack of documents; Complex process; Corruption/bribe demanded; Other |
| q25_other | अन्य कारण लिखें | Other reason | open text | |
| q26 | 26. क्या आपको न्यूनतम वेतन अधिनियम और अपने श्रमिक अधिकारों की जानकारी है? | Q26 Awareness of minimum wage and rights | one choice | Yes, good knowledge; Some knowledge; Not at all |
| q27 | 27. क्या आप या परिवार का कोई सदस्य काम के लिए बिहार से बाहर गए हैं? | Q27 Migration for work | one choice | Yes, myself; Yes, family member; No |
| q28 | 28. प्रवास का मुख्य कारण क्या था? (एक से अधिक चुन सकते हैं) | Q28 Reasons for migration | multiple | Lack of local work; Low wages; To repay debt; Better opportunity |
| q29 | 29. प्रवास की अवधि और बारंबारता क्या है? | Q29 Duration and frequency | one choice | 1-2 times a year, few weeks; 1-2 times a year, several months; Almost full year away; Not applicable |
| q30 | 30. मुख्य प्रवास गंतव्य कौन सा है? | Q30 Main destination | one choice | Delhi/NCR; Punjab/Haryana; Maharashtra; Other; Not applicable |
| q30_other | अन्य गंतव्य लिखें | Other destination | open text | |
| q31 | 31. क्या बिहार में उचित रोजगार मिल जाए, तो आप प्रवास नहीं करेंगे? | Q31 Would stay if local work | one choice | Yes, definitely; Maybe; No, better outside |
| q32 | 32. क्या आपके परिवार में अन्य सदस्य भी असंगठित क्षेत्र में कार्यरत हैं? | Q32 Other family in informal sector | one choice | Yes; No; Some members |
| q33 | 33. क्या आपके बच्चे स्कूल जाते हैं? | Q33 Children in school | one choice | Yes, regular; Yes, irregular; Not going; No children/NA |
| q34 | 34. यदि कोई श्रमिक बीमार हो जाए, तो क्या परिवार के पास आय का कोई अन्य साधन है? | Q34 Alternative income if sick | one choice | Yes, enough; Yes, but limited; No, none |
| q35 | 35. क्या आपके क्षेत्र में श्रमिकों के लिए कोई पंचायत स्तरीय सहायता केंद्र है? | Q35 Panchayat help centre | one choice | Yes; No; Don't know |
| q36 | 36. कुल मिलाकर, क्या आप अपने वर्तमान कार्य से संतुष्ट हैं? | Q36 Satisfied with work | one choice | Yes; No; Not satisfied, but no option |
| q37 | 37. आपकी राय में असंगठित क्षेत्र के श्रमिकों की सबसे बड़ी समस्या क्या है? | Q37 Biggest problem of informal workers | open text | |
| q38 | 38. सरकार से आप किन सुविधाओं या बदलावों की अपेक्षा करते हैं? | Q38 Expectations from government | open text | |
| notes | टिप्पणी | Notes | open text |
Fifty-six fields in all, of which 38 are substantive questions; the remainder record the enumerator, the date, the paper identifier, the location and the respondent’s details. The XLSForm itself is published with the dataset.
Social protection: receipt, knowledge and barriers
Thirty-six per cent of respondents hold an Ayushman Bharat card, 29 per cent have had rural employment guarantee work, 8 per cent hold a shramik card, and fewer than 2 per cent each have had PM Shram Yogi Maandhan or skill training. Twenty-nine per cent have received nothing from any of the five. Among the 278 who have received something, 260 received exactly one scheme, 17 two and one person three. Social protection in this sample is a single thin thread per household rather than a net.
The shramik card figure is the sharpest contrast with the administrative record. Bihar had roughly 3.24 crore e-Shram registrations by early 2026, second only to Uttar Pradesh, and the state also maintains a construction workers’ welfare board. In this sample, 92 per cent of labourers hold no shramik card at all. Three readings are possible: the registration drive did not reach these wards; people were registered but hold no card and do not know they are on a list; or the word “shramik card” means different things to respondent and portal. The questionnaire did not distinguish an e-Shram card from a Bihar Building and Other Construction Workers Welfare Board card, and that must be fixed in the next round, because the two carry different entitlements and different registration routes.
Possession and understanding diverge just as sharply. Of the 142 respondents who hold an Ayushman Bharat card, 70 per cent say they do not know whether they have health insurance and 5 per cent say they do. Ayushman Bharat is health insurance. Across the whole sample, 49 per cent do not know whether they are insured and 70 per cent do not know whether their panchayat has a help centre for workers. The rural Bihar study published in Cureus in 2023 found the same structure at a different point of the chain: awareness of the scheme at 68.6 per cent, cards among 58 per cent of eligible and aware respondents, and utilisation at 1.3 per cent. Cards are reaching households faster than knowledge of what they do.
Asked why a benefit had not come, 36 per cent named missing documents, 21 per cent a bribe, 20 per cent a complicated process, 4 per cent another reason, and 19 per cent said the question did not apply to them. The answer changes with position in the system. Among those who had received nothing at all, the most common answer was a bribe (31 per cent), then process (27 per cent), then documents (23 per cent). Among those who had received something, documents came first at 41 per cent. People already partly inside the system describe a paperwork problem; people entirely outside it more often describe being asked for money. The question was put to everyone rather than scheme by scheme, so the answers mix barriers to schemes received with barriers to schemes not received, and should be read as indicative.